Contents
- Access the Configuration Panel
- Configuring a Pie Chart
- Configuring a Bar Chart
- Creating a Radar Chart
- Creating a Risk Map
- Configuring a Template Report
- Configuring Application Tree Grids
- Chart Options
- Frequently Asked Questions
Access the Configuration Panel
For all portlet types that have been added to a dashboard, configuration can be accessed by the following:
- Click on the
 icon
icon - Click on Configuration
This will then display configuration options for the particular portlet.
Configuring a Pie Chart
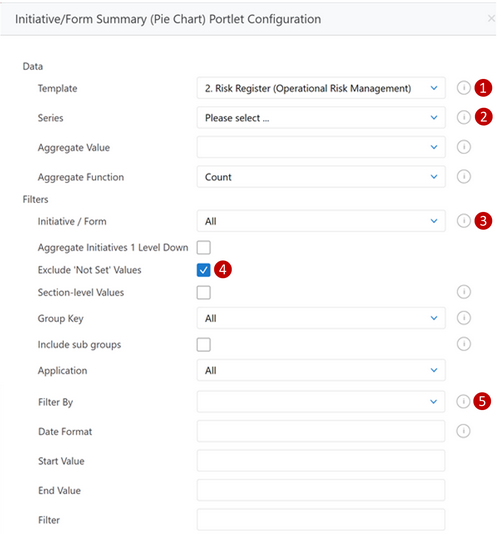
| Ref | Item | Description |
| 1 | Template | Select the template. |
| 2 | Series | Select the parameter. |
| 3 | Initiative/Form | Select an Initiative or a single Form. Remember, an Initiative is a group of forms. This form or group of forms must hold the data of interest. |
| 4 | Exclude "Not Set" Values | Tick here if you don't want to include the empty fields. |
| 5 | Filter By | You can select the parameter you want to filter by. |
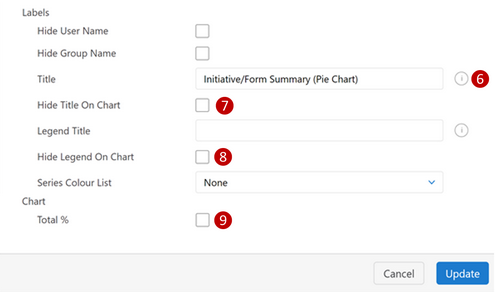
| 6 | Title | Give your pie chart a name by typing it into the title field under the labels section. |
| 7 | Hide Title on Chart | Tick here if you do not want to show the title of your pie chart. |
| 8 | Hide Legend on Chart | Tick here if you do not want to show the legend of your pie chart. |
| 9 | Total % | Tick here if you want to show the data of the pie chart as a percentage. |
Once you are happy with these settings, click "Update" and your pie chart will be displayed on your dashboard.
Configuring a Bar Chart
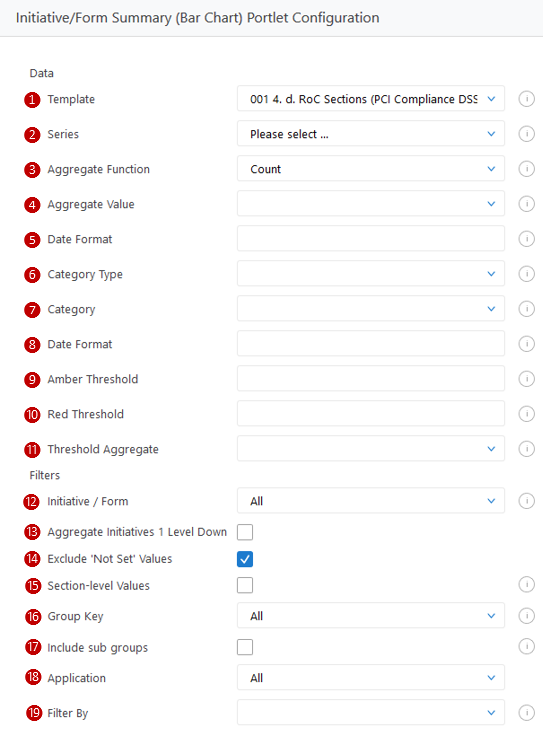
| Ref | Item | Description |
| 1 | Template | Select the template to base the portlet on. |
| 2 | Series | The parameter that is displayed on the x-axis |
| 3 | Aggregate Function | Select how responses are aggregated. |
| 4 | Aggregate Value | Select the value to use the sum and average aggregate functions on. |
| 5 | Date Format | Date format of the output. Please click on  in the platform to see all syntax. in the platform to see all syntax. |
| 6 | Category Type | Select the type of category to be used on the category axis. |
| 7 | Category | Select the particular category from the template. |
| 8 | Date Format | See above. |
| 9 | Amber Threshold | Value for the amber threshold line (optional) |
| 10 | Red Threshold | Value for the red threshold line (optional) |
| 11 | Threshold Aggregate | Aggregate function used for the black threshold line (optional) |
| 12 | Initiative/Form | Select a particular initiative to base the data on. |
| 13 | Aggregate Initiative 1 Level Down | Aggregate all initiatives within the initiative you have selected. |
| 14 | Exclude 'Not Set' Values | Select whether to include data that has not been set by a user. |
| 15 | Section-level Values | If this box is checked, values are only plotted against each other if they come from the same Section within the Form. |
| 16 | Group Key | Used to select responses from forms that belong to a specified group. |
| 17 | Include sub groups | If checked, all responses from a group and all of its subgroups are selected. If unchecked, only responses from the group will be selected. |
| 18 | Application | Select which application you would like to view data for i.e. GDPR, PCI etc. |
| 19 | Filter By | Select which parameter to filter the data by. |
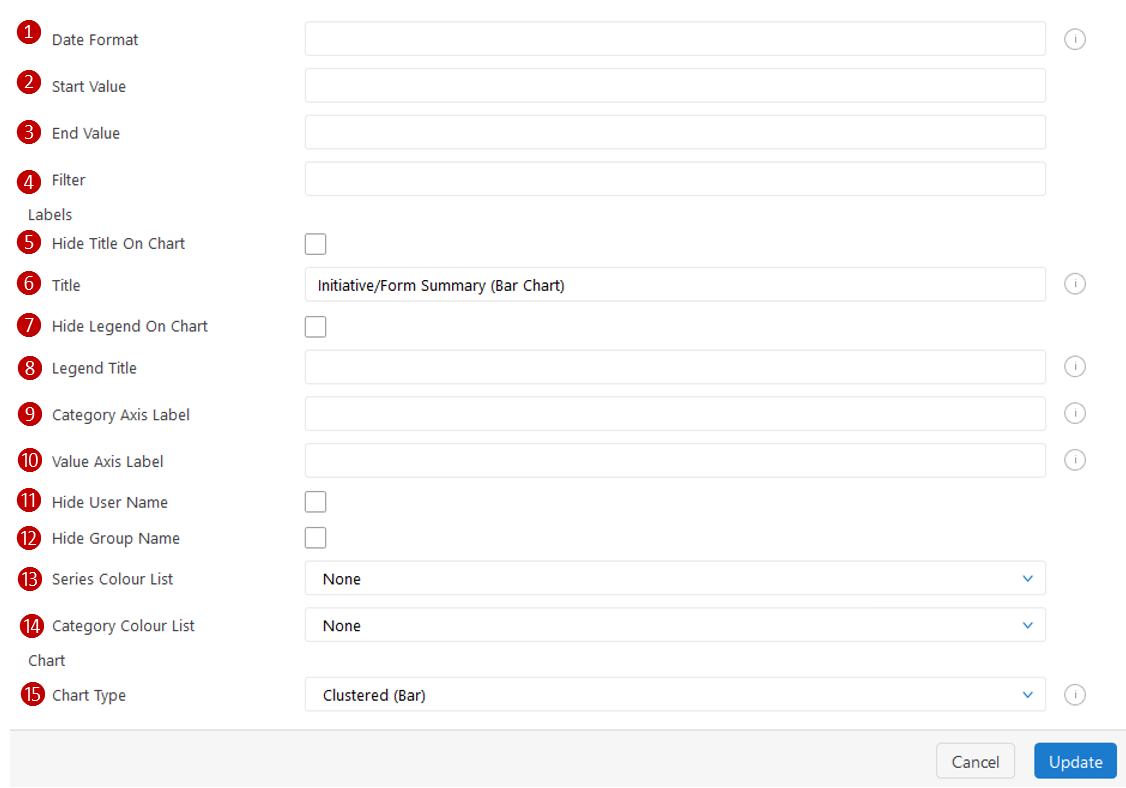
| Ref | Item | Description |
| 1 | Date Format | Same as 5 above. |
| 2 | Start Value | Start value for date. |
| 3 | End Value | End value for date. |
| 4 | Filter | Type in a value to filter the date. |
| 5 | Hide Title On Chart | Check to hide the title on the chart. |
| 6 | Title | Text field to enter a chart title. |
| 7 | Hide Legend On Chart | Check to hide legend on chart. |
| 8 | Legend Title | Text field to enter the legend title. |
| 9 | Category Axis Label | Text field to enter a category axis label. |
| 10 | Value Axis Label | Text field to enter a value axis label. |
| 11 | Hide User Name | Check to hide user names. |
| 12 | Hide Group Name | Check to hide group name. |
| 13 | Series Colour List | Add colours to your option list. |
| 14 | Category Colour List | Add colours to your option list. |
| 15 | Chart Type | Select the type of the chart you want to see. |
Creating a Radar Chart
To create a Radar Chart, add a Bar Chart and then selet Radar under the Chart Type.
Creating a Risk Map
Currently, Risk Heat Maps are only available on the Classic Dashboard.
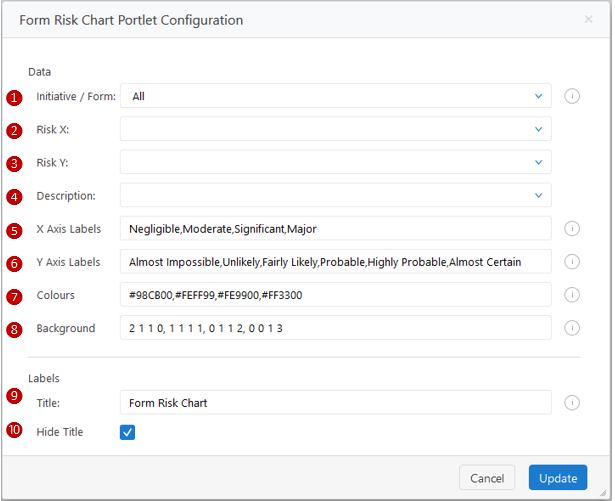
| Ref | Item | Description |
| 1 | Initiative/Form | Select a particular initiative to base the data on. |
| 2 | Risk X | Select the impact parameter on the x-axis. |
| 3 | Risk Y | Select the likelihood parameter on the y-axis. |
| 4 | Description | Add a description for the portlet. |
| 5 | X Axis Label | Add a label for the x-axis. Note: this label needs to match with your impact reference form. |
| 6 | Y Axis Labels | Add a label for the y-axis. Note: this label needs to match with your likelihood reference form. |
| 7 | Colours | Add colours to your heat map. |
| 8 | Background | Ever risk heat map is unique. In this example, we have a 4x4 risk matrix. The first column (2 1 1 0): the first two cells have colour code #98CB00, the third cell has colour code #FEFF99 and the final cell has colour code #FE9900. |
| 9 | Title | Give the risk map a name. |
| 10 | Hide Title | Check to hide the title on the portlet. |
Configuring a Template Report
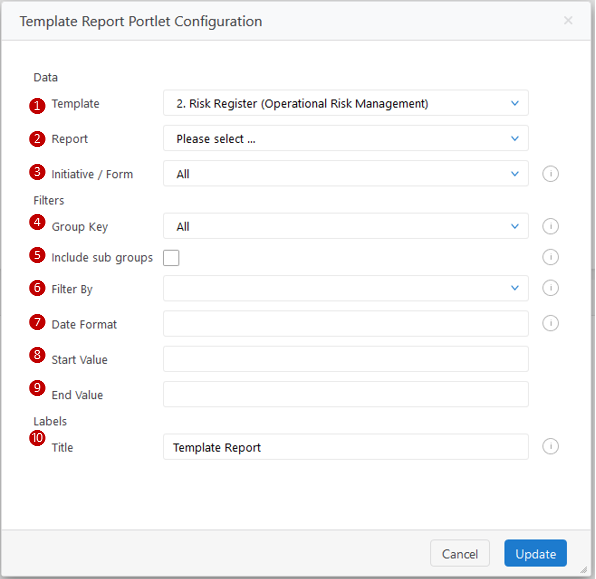
| Ref | Item | Description |
| 1 | Template | The template to base the form on. |
| 2 | Report | Choose what data to report from. |
| 3 | Initiative/Form | Select a particular initiative to base the data on. |
| 4 | Group Key | Used to select responses from forms that belong to a specified group. |
| 5 | Include sub groups | If checked, all responses from a group and all of its subgroups are selected. If unchecked, only responses from the group will be selected. |
| 6 | Filter By | Select which paramater to filter the data by. |
| 7 | Date Format | Date format of the output. Please click on in the platform to see all syntax. |
| 8 | Start Value | Start date. |
| 9 | End Value | End date. |
| 10 | Title | Title of the portlet. |
Configuring Application Tree Grids

The Application is the Form (or group of Forms) you want to appear in your Application Dashlet.
You can use the Title to change the header of your tree grid.
Chart Options
The table below summarises the different fields available for selection in Charts configuration. Some of these fields will not be displayed depending on the type of Chart selected.
This is the guidance that is provided on each of the chart parameters:
| Data | Description |
| Initiative | The 'Initiative' is used to select a specific Initiative or Form. If 'All' is selected, then all Forms will be used. |
| Template | The selected 'Template' is used to filter the available Responses in the 'Series', 'Aggregate Value', 'Category' lists and “Reports” (Template Reports). |
| Series | The 'Series' list is used to select the Response used for grouping the data. |
| Aggregate Function |
The 'Aggregate Function' is used to determine how Responses are
|
| Aggregate Value | The 'Aggregate Value' is used to select the Response the 'Aggregate Function' uses in calculating the Sum and Average values. |
| Exclude "Not Set" Values | Enables the User to exclude values in the Form that have not had a value set by a User. |
| Date Format | Sets the expected date format from the Form. For further information hover over the Guidance icon. |
| Category Type |
Use the ' Category Type' field to select the type of value to be used on
|
| X Axis Labels / Y Axis Labels | Comma-delimited list of labels, e.g. Remote, Unlikely, Possible, and Probable. |
| Colours | Comma delimited list of colours. |
| Filters | Description |
| Initiative/Form | The 'Initiative / Form' filter is used to select a specific Initiative or Form. If 'All' is selected, then all responses for the selected Template response will be used. |
| Status | The 'Status' filter is used to select Tasks of the specified Status. |
| Priority | The 'Priority' filter is used to select Tasks of the specified Priority. |
| Owner | The 'Owner' filter is used to select Tasks owned by the specified Owner. |
| Assignee | The 'Assignee' filter is used to select Tasks assigned to the specified Assignee. |
| Group | The 'Group' filter is used to select Tasks from Forms that belong to a specified Group. |
| Include sub groups |
|
| Include Alerts |
|
| Source | The 'Source' filter is used to select Tasks from a specified source. |
| Project | The 'Project' filter is used to select Tasks that belong to a specified Project. |
| Filter By | The 'Category' is used to select the response used in generating the category axis. |
| Date Format | Please supply date formats for both the input and output dates. For further information hover over the guidance icon. |
| From Value | |
| To Value |
| Labels | Description |
| Title | The Chart Title. |
| Legend Title | The Title for the Chart Legend. |
| Category Axis Label | The label for the Category axis. |
| Value Axis Label | The label for the Value axis. |
| Hide Title | Hides the Title. |
| Hide Legend | Hides the Legend. |
| Charts | Description |
| Chart Type | Select the type of Chart to be produced. |
| Horizontal Key | Select to display the key across the bottom of the Chart. |
Frequently Asked Questions
| Question | Answer |
|
Why am I not seeing any information in my Dashboard? |
You most likely do not have Permission to the Form(s) if you are not seeing any data. If you have permission to view the information check the configuration settings on the chart |
| Why can I not add a Heat Map to my Dashboard? | Heat Maps are currently only available on the Classic Dashboard |
| What is the difference between a Classic Dashboard and Global Dashboard? | Global Dashboards are different to the Classic Dashboard because they can be shared between Users |
Some examples, either here or in the platform, of what the date should actually look like when you enter it according to the format, would be useful. I.e. Does "DD MM YYYY" = "01 01 2020" or "01/01/2020" or "01012020" or "01-01-2020" etc. etc.? It's not clear currently.
We would like to have a portlet that shows new items in the past 30 and 90 days? How can I apply conditional filtering?