Displaying Data
It is possible to hide one or more parameters, so the chart will only show the remaining ones.
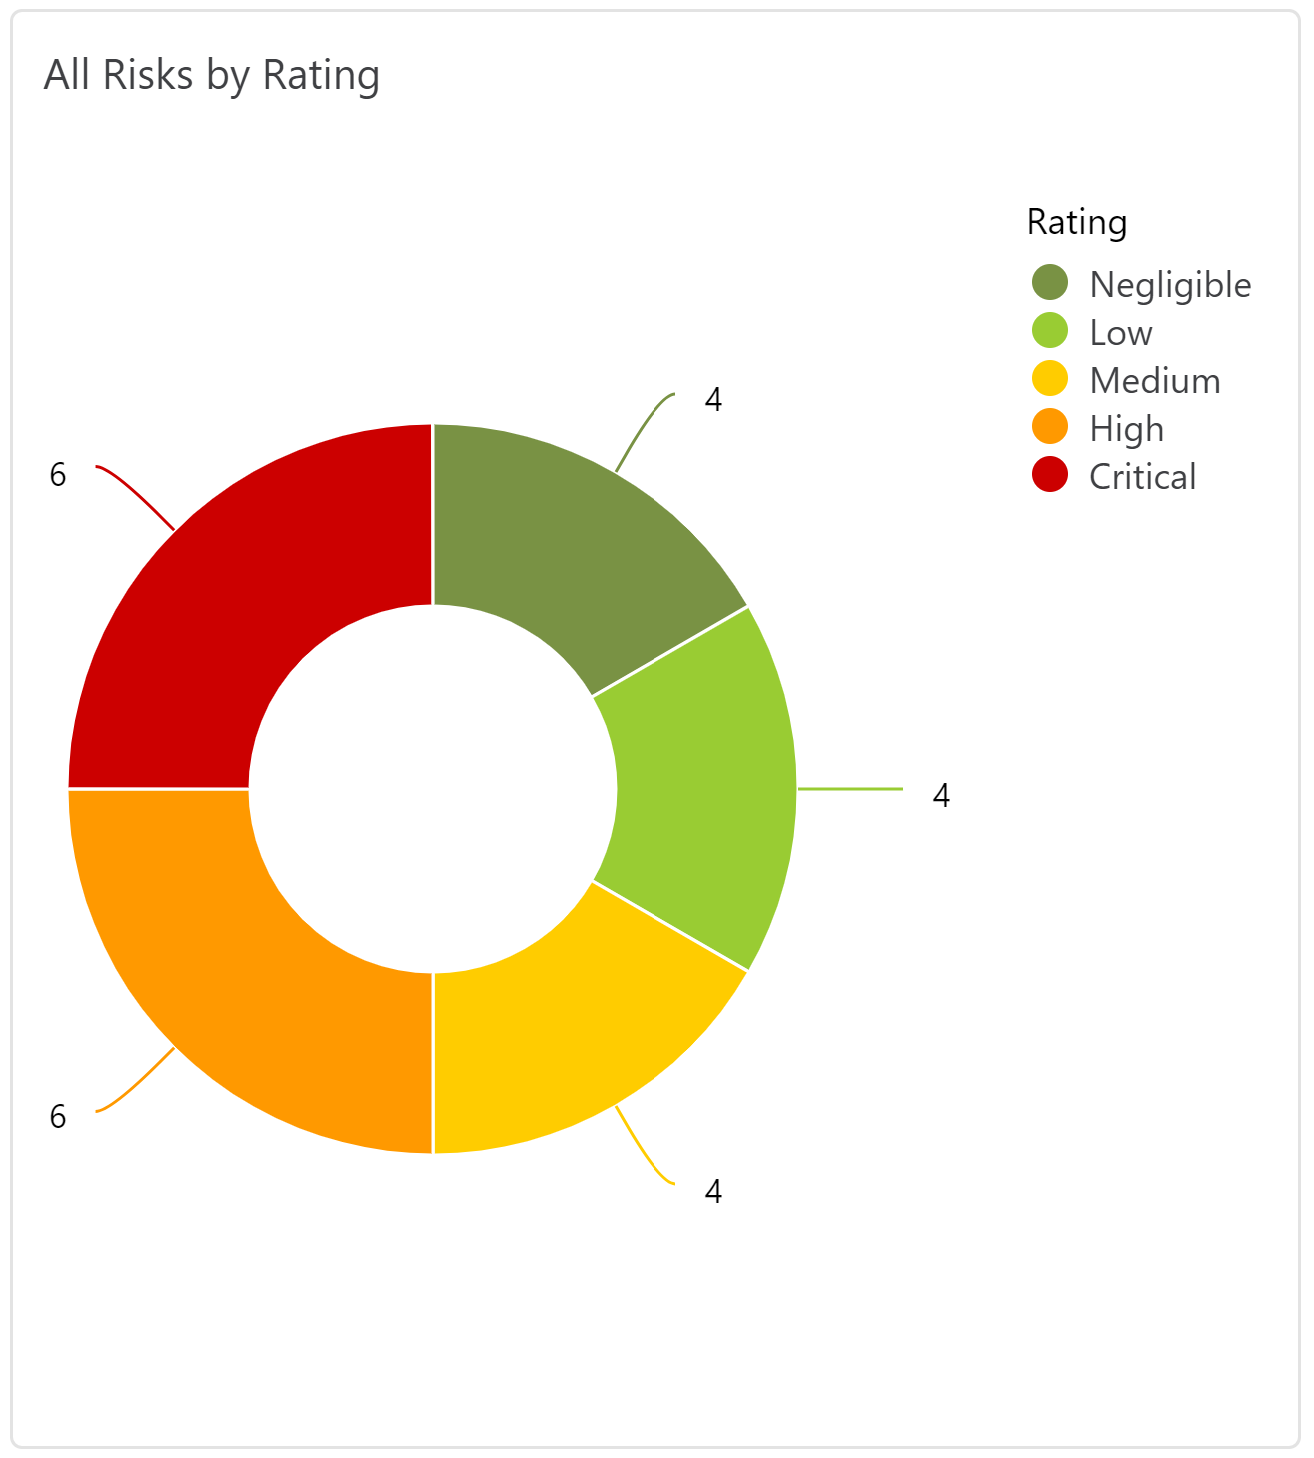
To do this, click the parameter you want to hide in the key. The select parameter becomes grey in the key, and will be hidden from your chart:
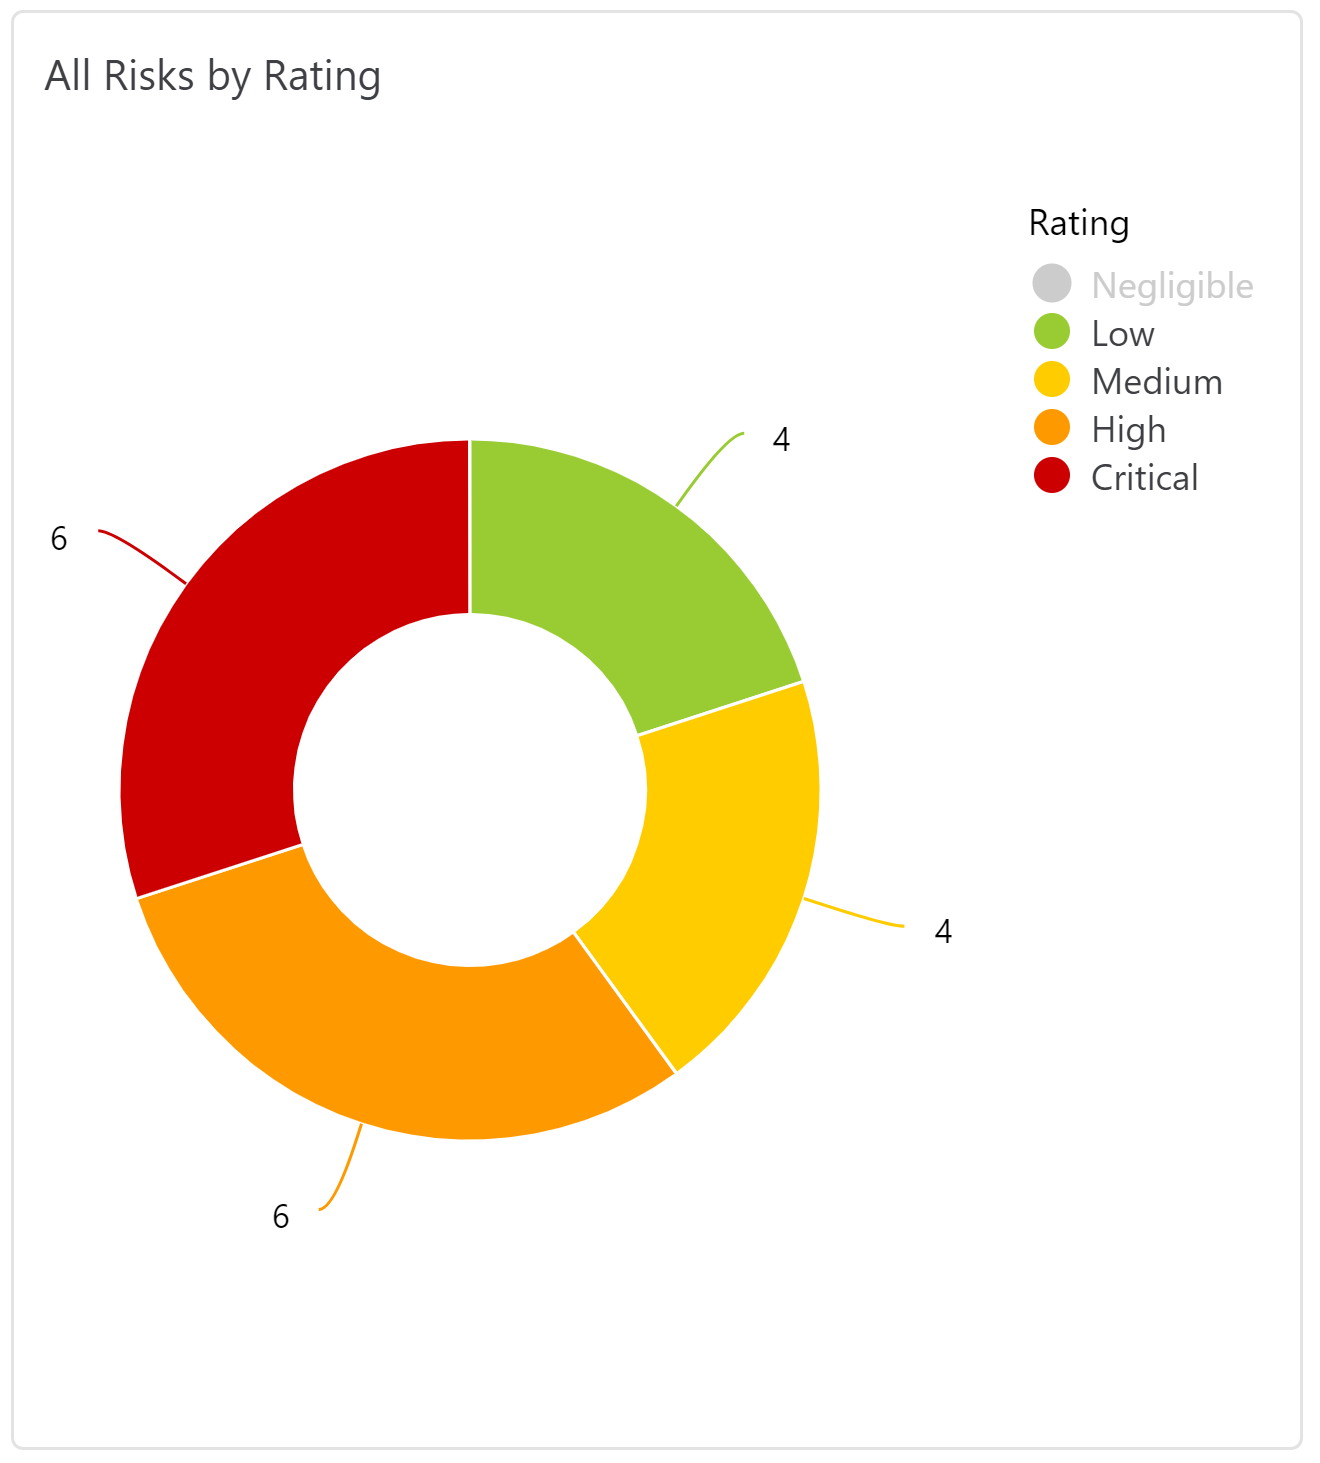
Click on the parameter again to display it.
Drilling into Chart Data
It is possible to see the underlying data of any Pie Chart of Bar Graph - to do this, click on the section you want to drill into. This will then display the underlying data. You have the ability to order this data, run a search on it and export it to Excel.
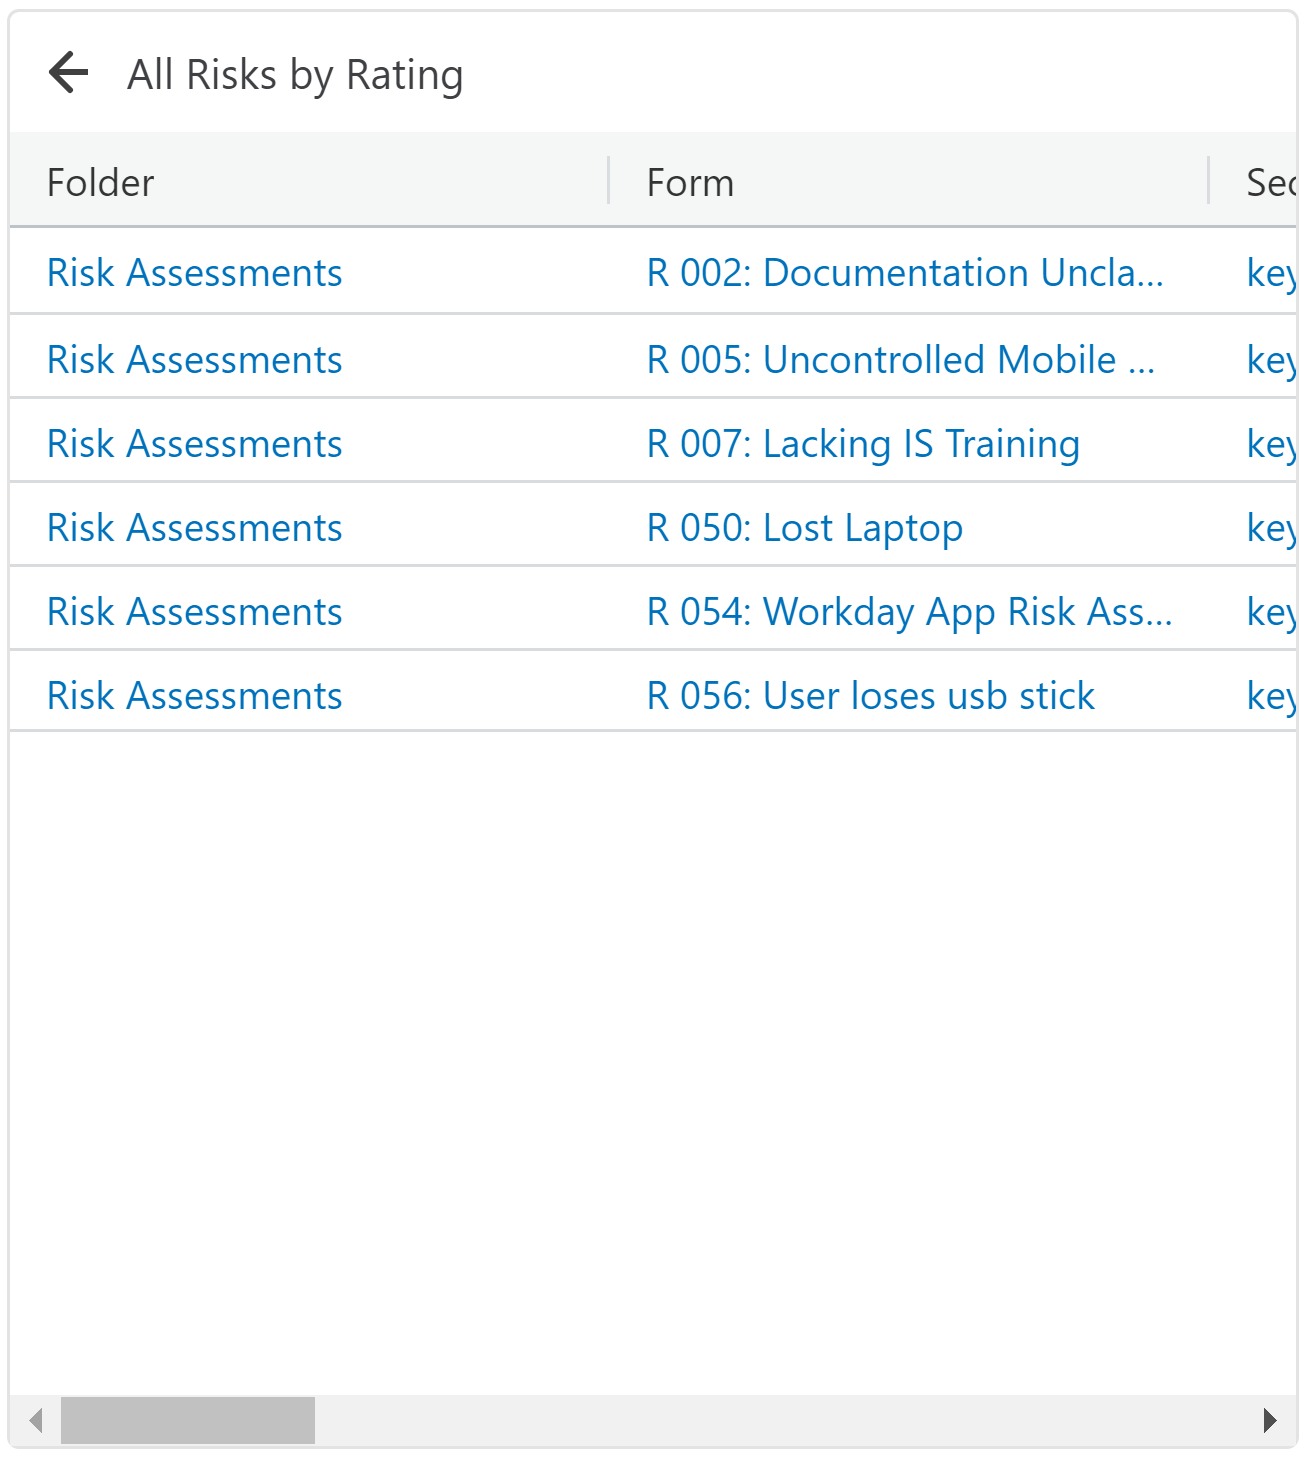
Each column can be re-arranged whilst viewing, and can also be searched by hovering over the column.
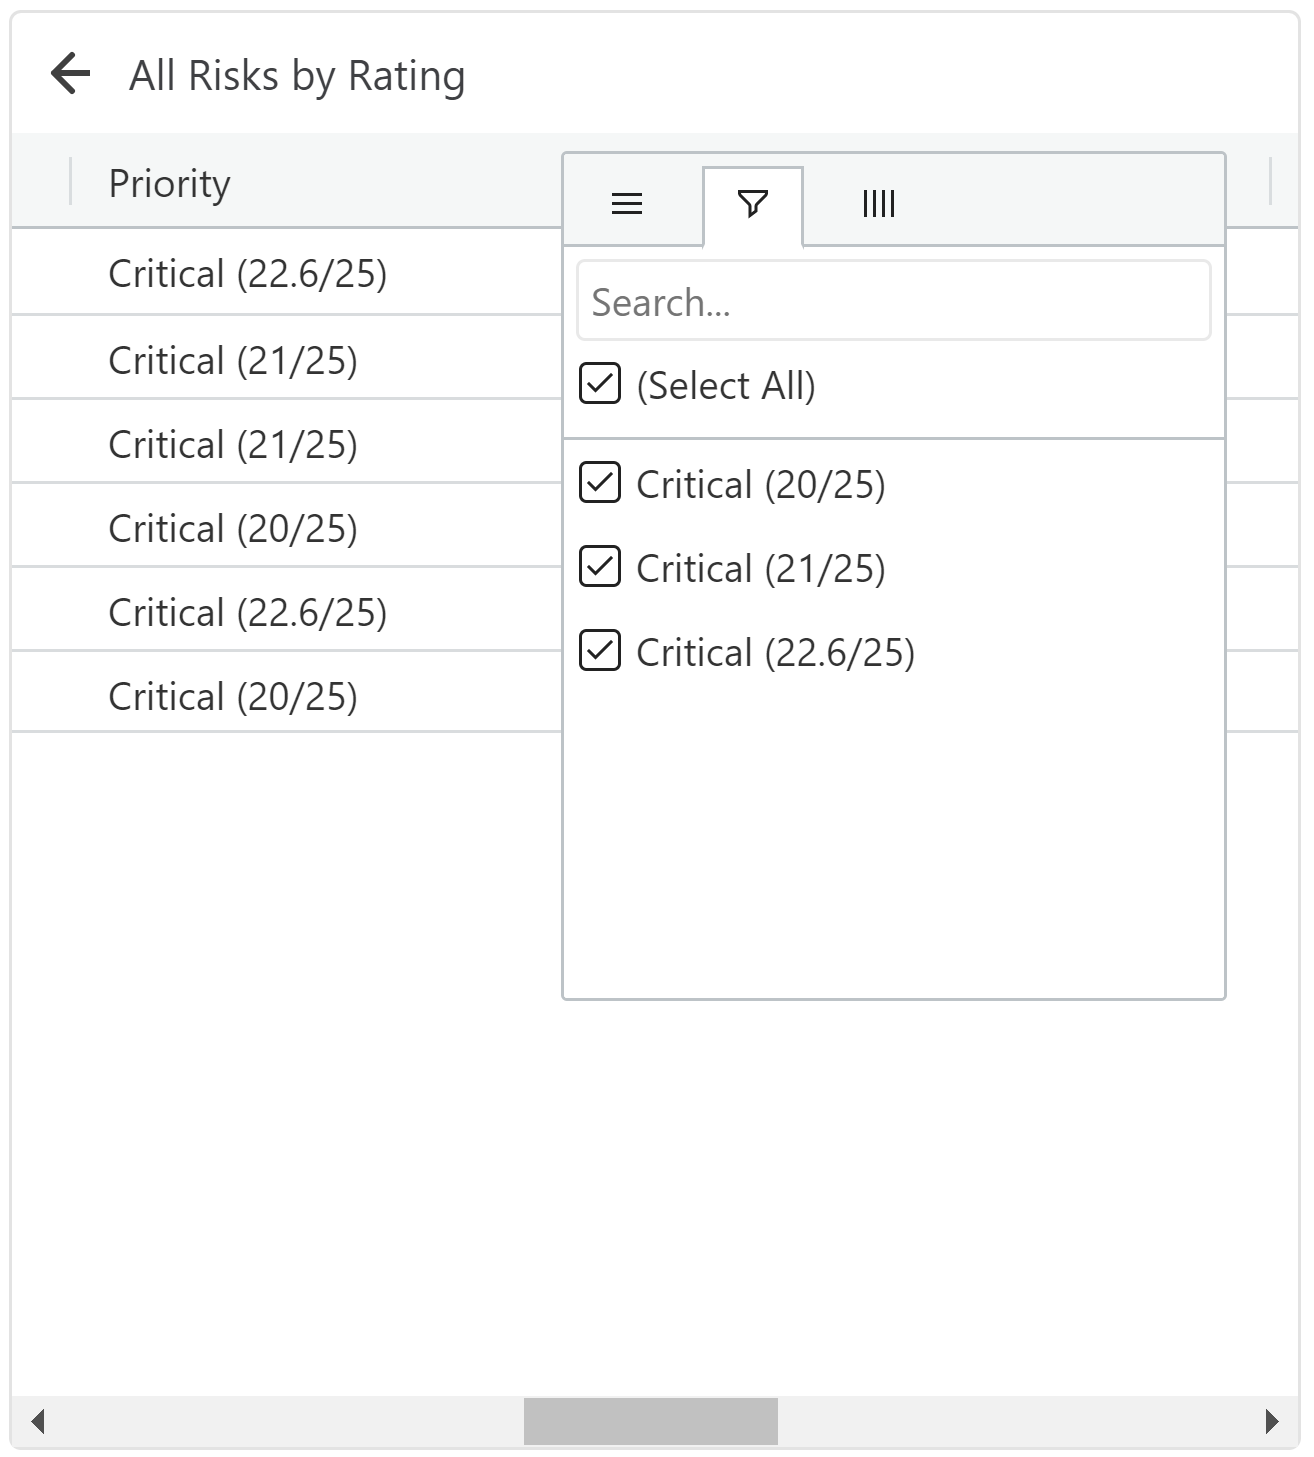
Search Data:
Clicking on the search function on each column will show a list of values to search from:
Export Data:
You can export data from any portlet at any time. If you choose to export data while displaying the high level information then just the high level data points will be exported. If you choose to export the chart after drilling into a specific part then just the data being displayed will export.
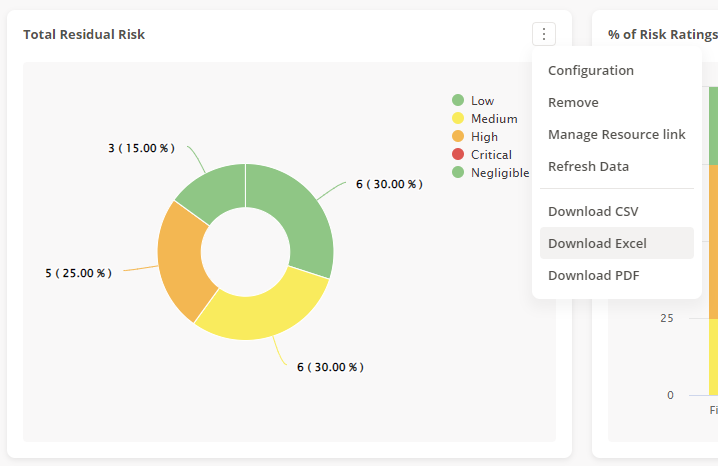
To export data from a portlet select the portlet ellipses menu and choose to download to either CSV, Excel or PDF.
Removing Portlets
When viewing local dashboards that you have subscribed to or created, you will also get some more options for exporting the data:
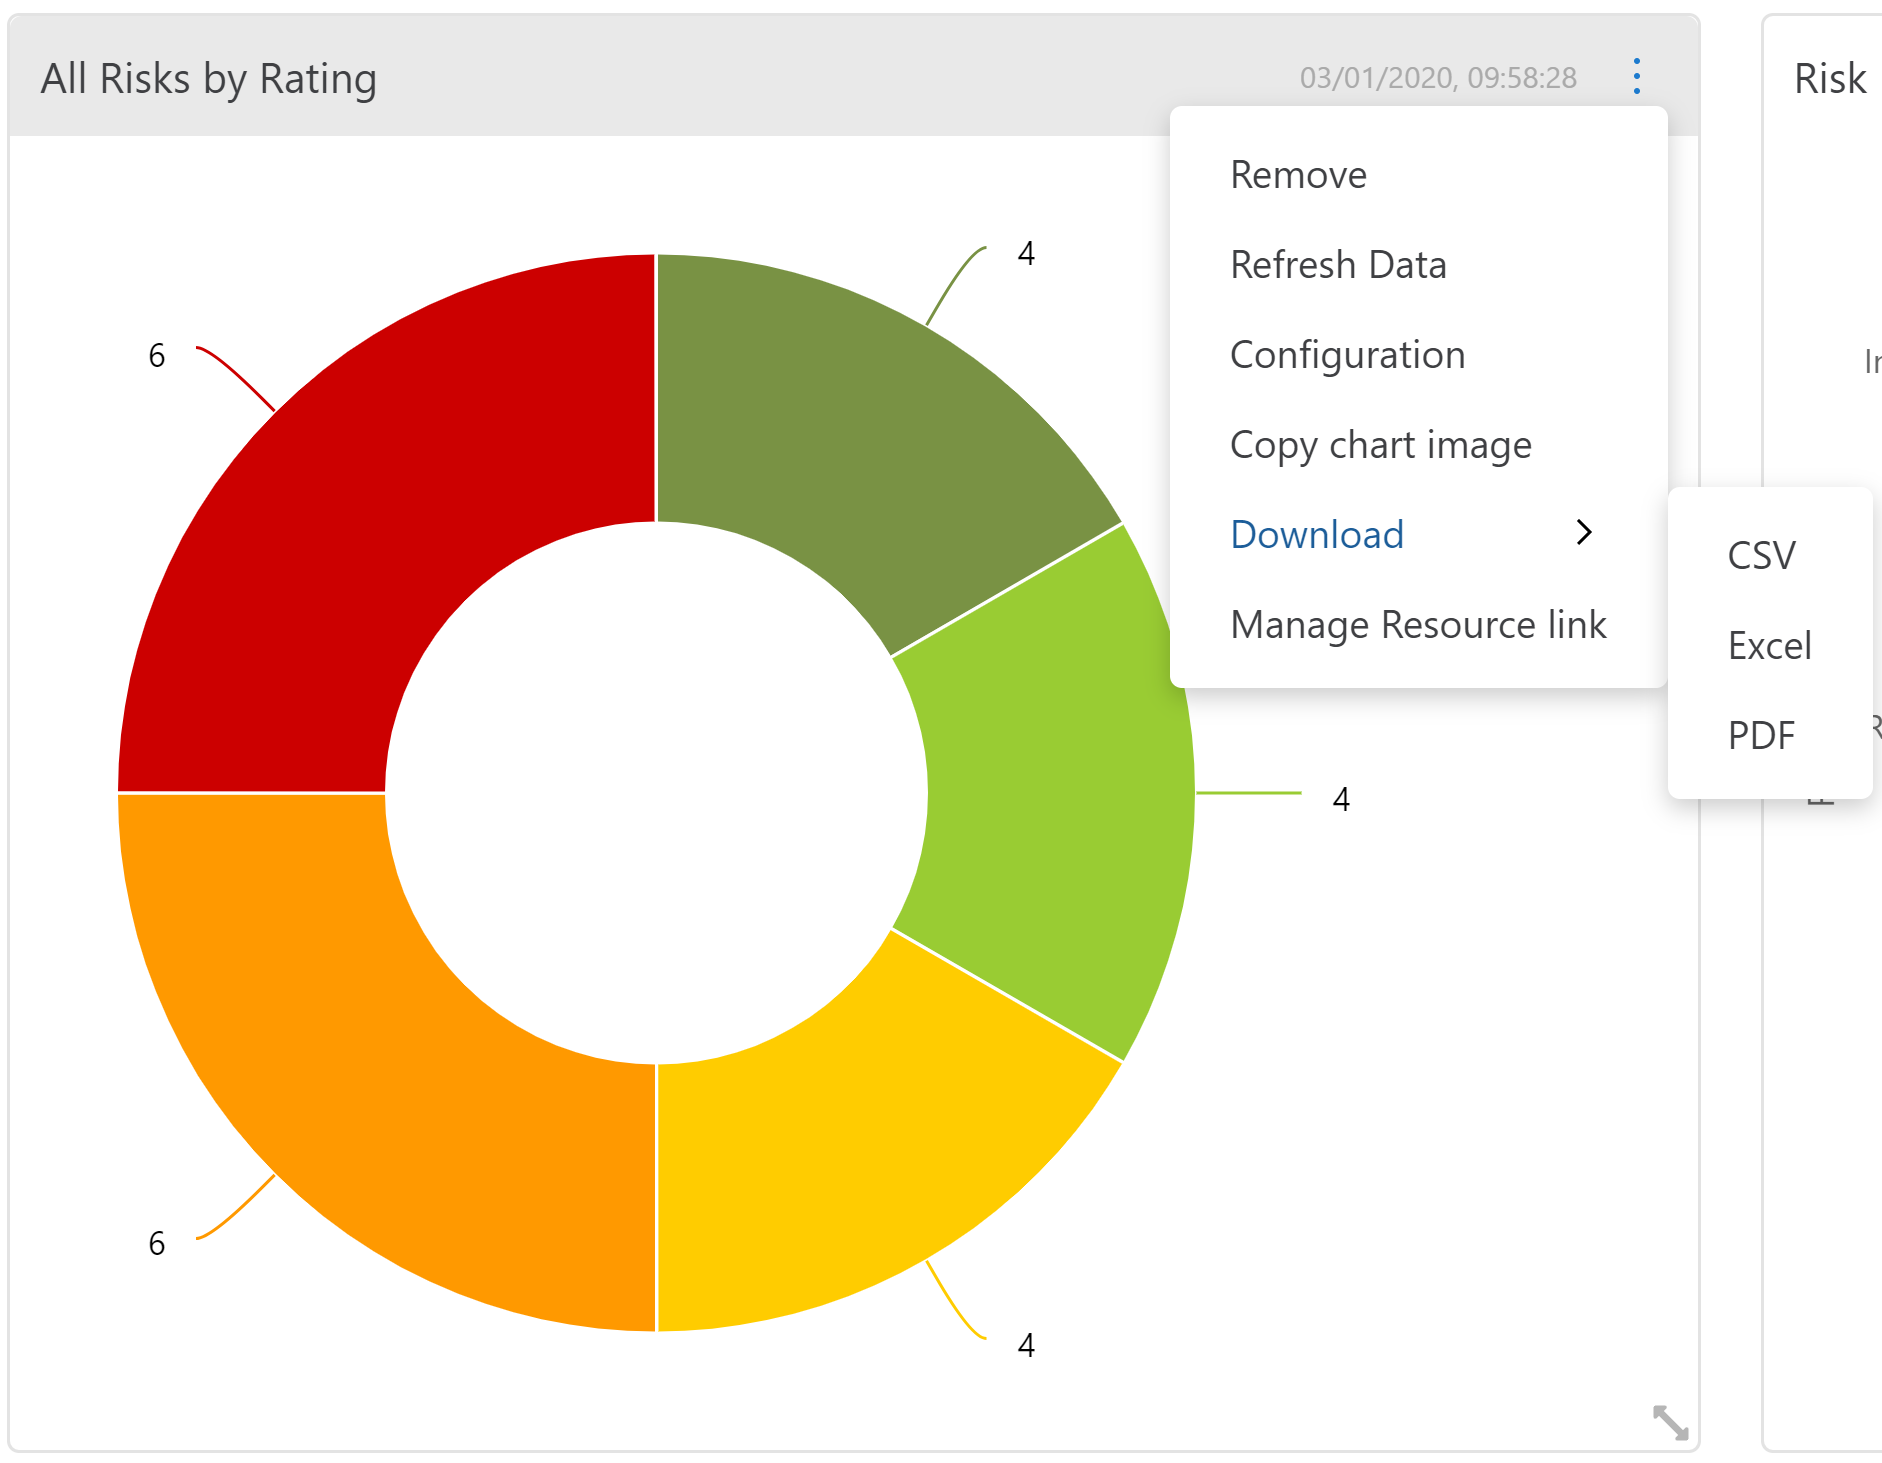
To see more about Copying a Chart Image, see Copying Charts. Users can download in CSV, Excel or PDF to get the data behind the portlet. For more information on the resource link, please see the article here.
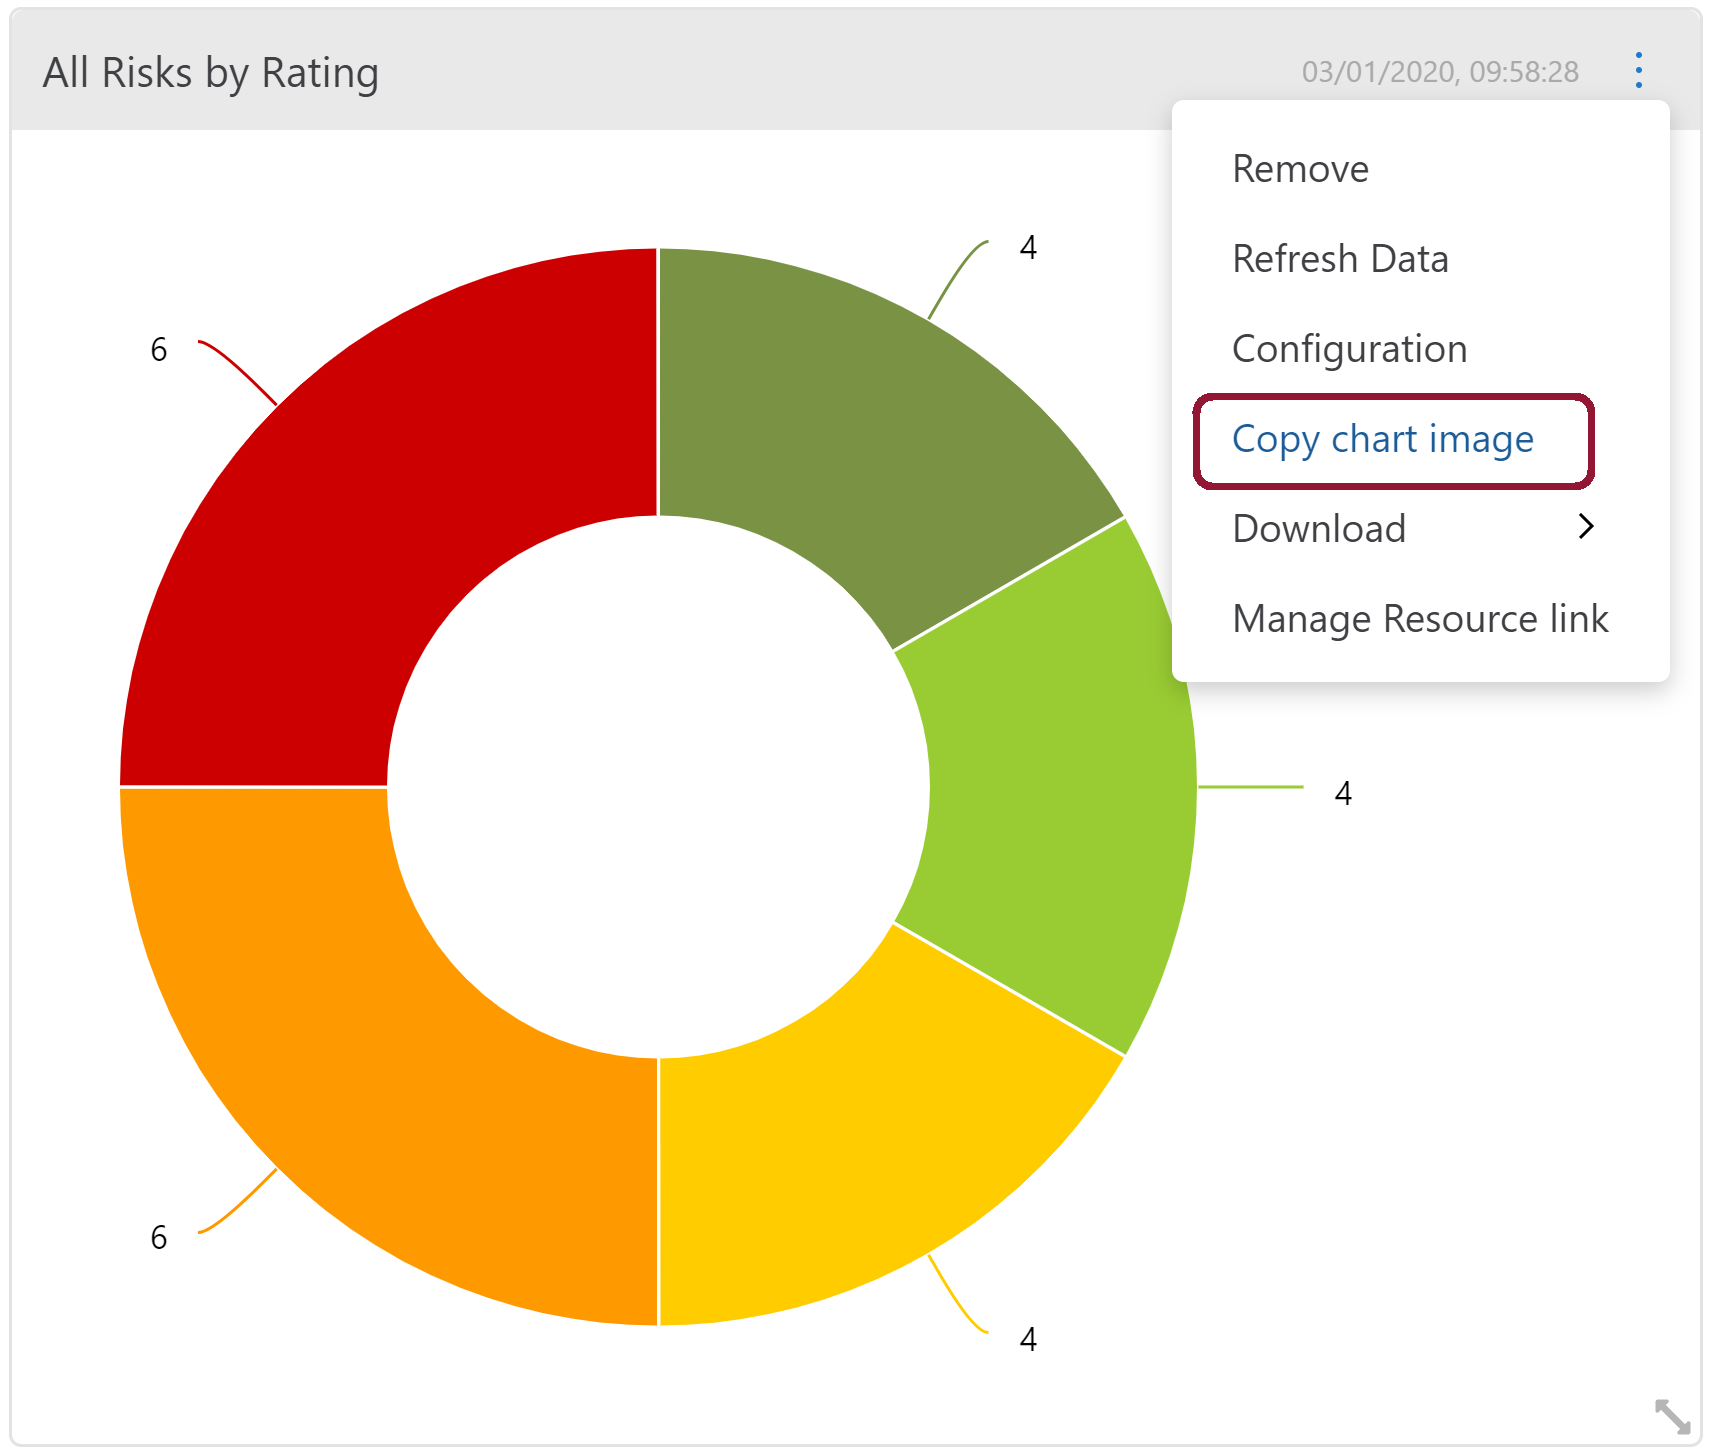
Copying Charts
Charts can be copied by selecting Copy Chart Image. This will produce a pop-up containing an image of the Chart. By right clicking on the picture of the Chart (not in the white space around it) you will be able to Save or Copy the Chart.
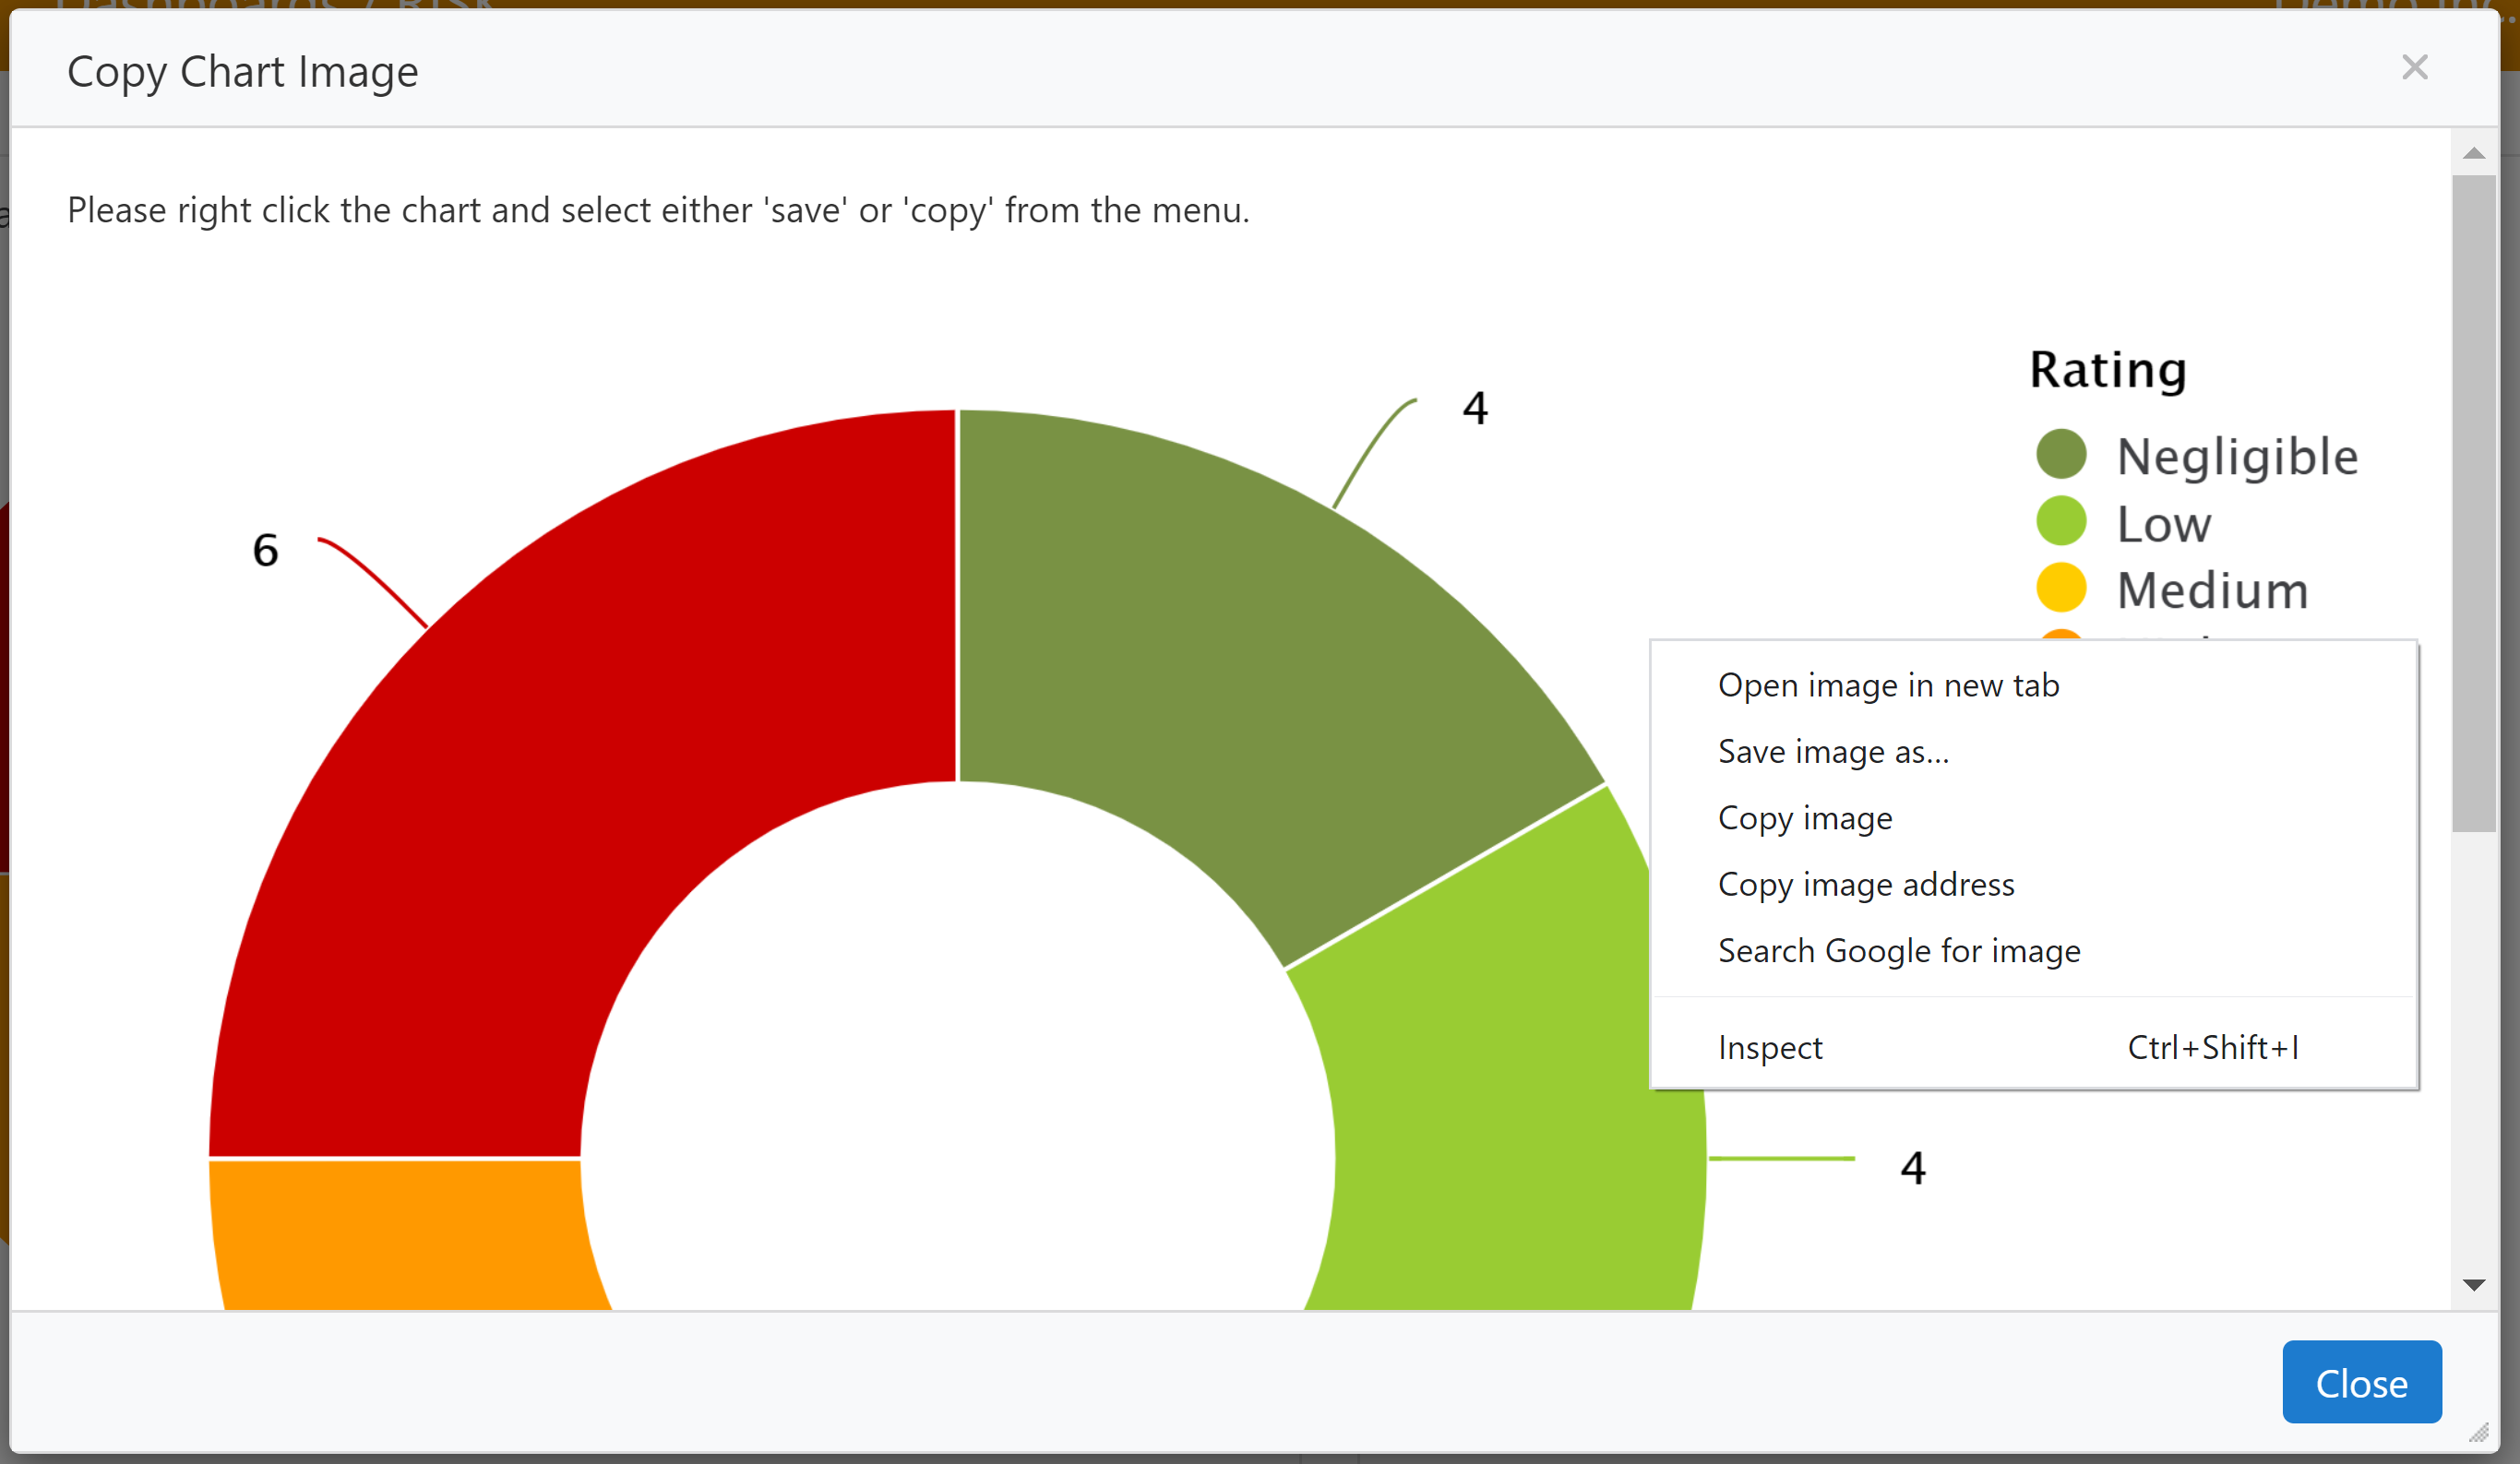
You will then be able to paste the image into programmes such as paint or Microsoft Word.
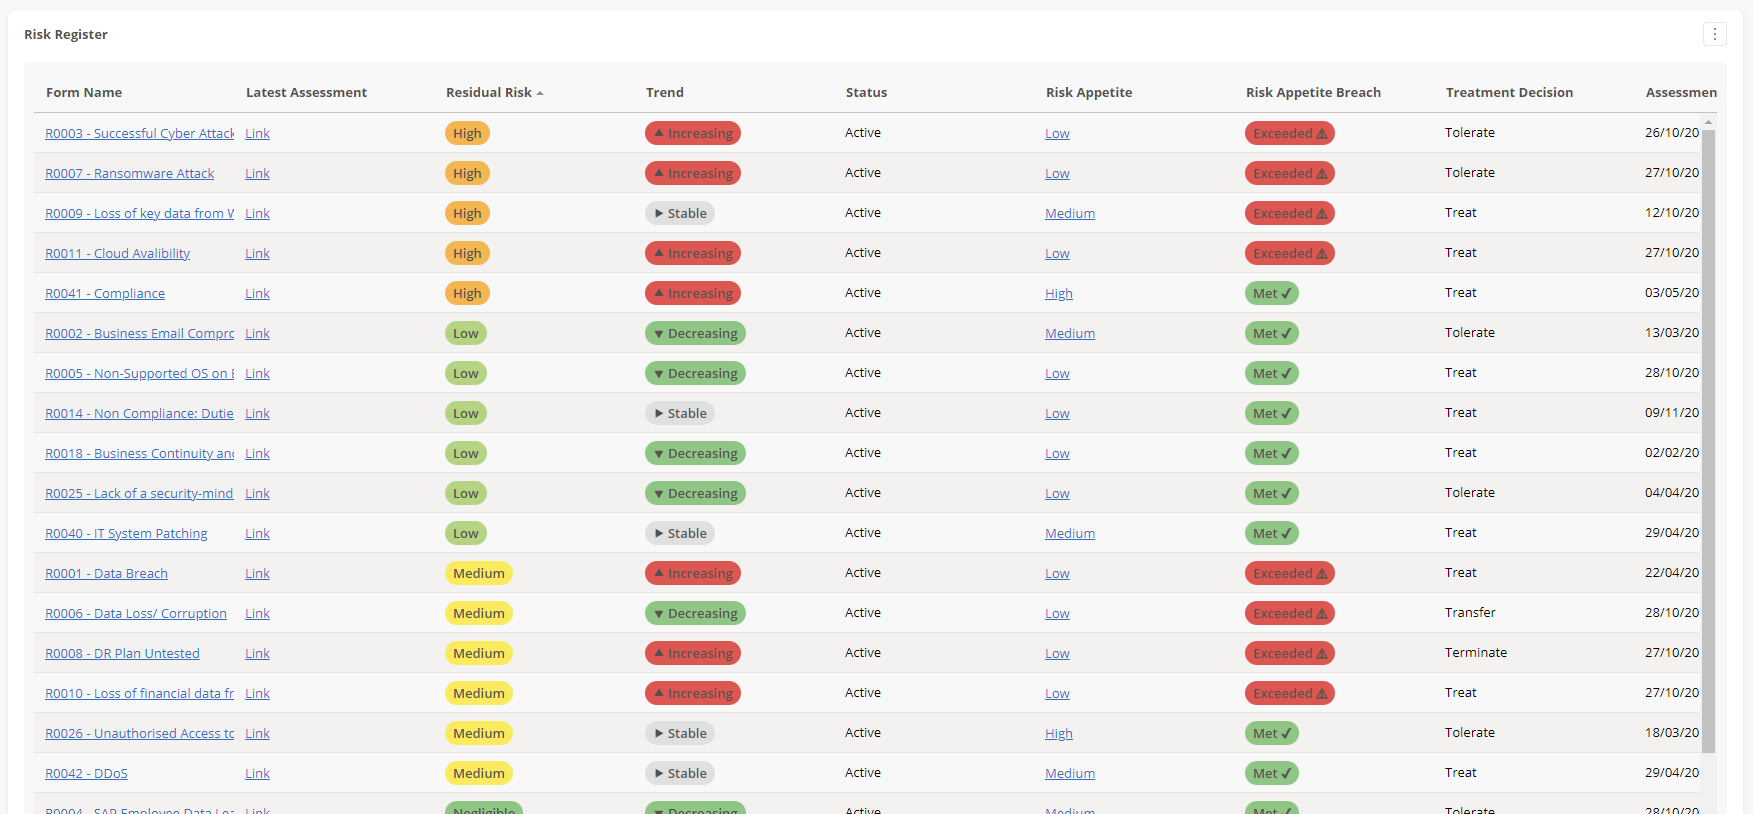
Template Reports
Template Reports are tabular reports that are configured within a Template. They are a way of distilling and presenting key data either from a single entity, or across similar entities.
The functionality of Template Reports’ allows Users to sort the data by one of the fields, order the fields within the table, and search the data for something of interest.
Sort: Click on the column header that you want to sort the data (A-Z). Click again to reverse (Z-A).
Order: Drag and drop any column to a new position. It will go back to the original position after you have logged out.
Comments