The Response History Chart is a way to report on the history on reports on a form, initiative or application level.
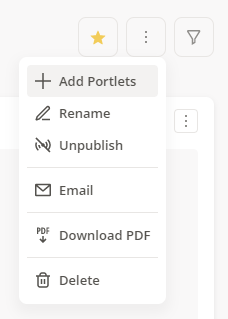
In order to create a Response History Chart, navigate to the desired dashboard and then click on the dashboard configuration ellipses button (top right hand corner) and select Add Portlets
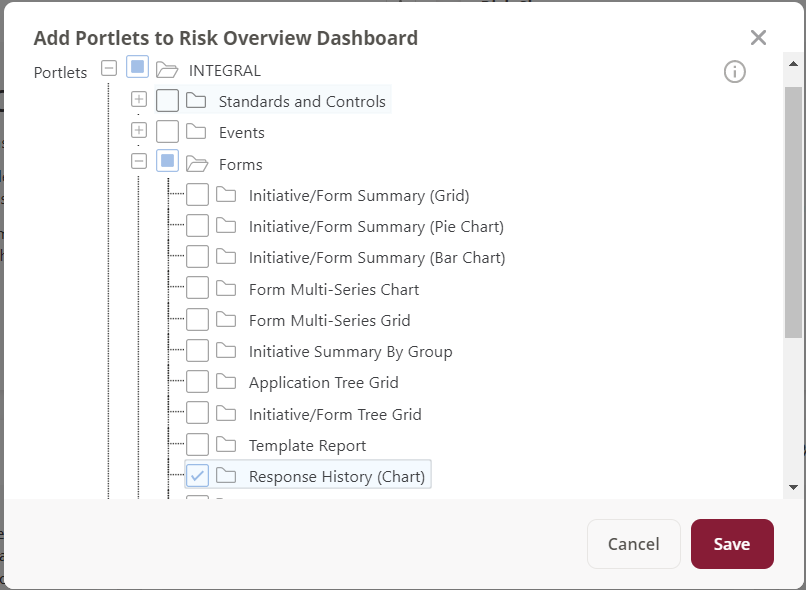
Select the Response History (Chart) option under INTEGRAL -> Forms and click Save.
Configuration
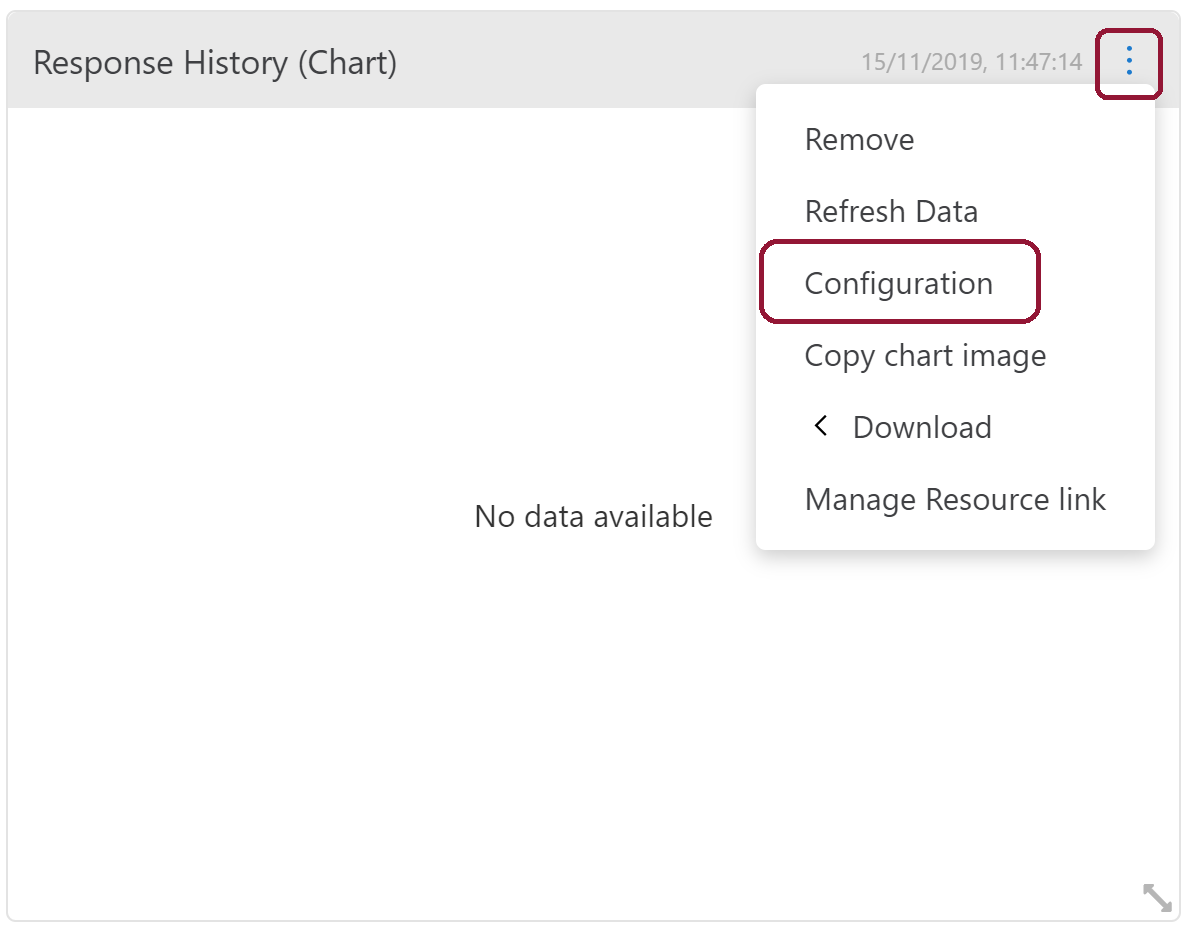
In order to configure this chart, click on the 3 ellipses on the newly added portlet, and click Configuration
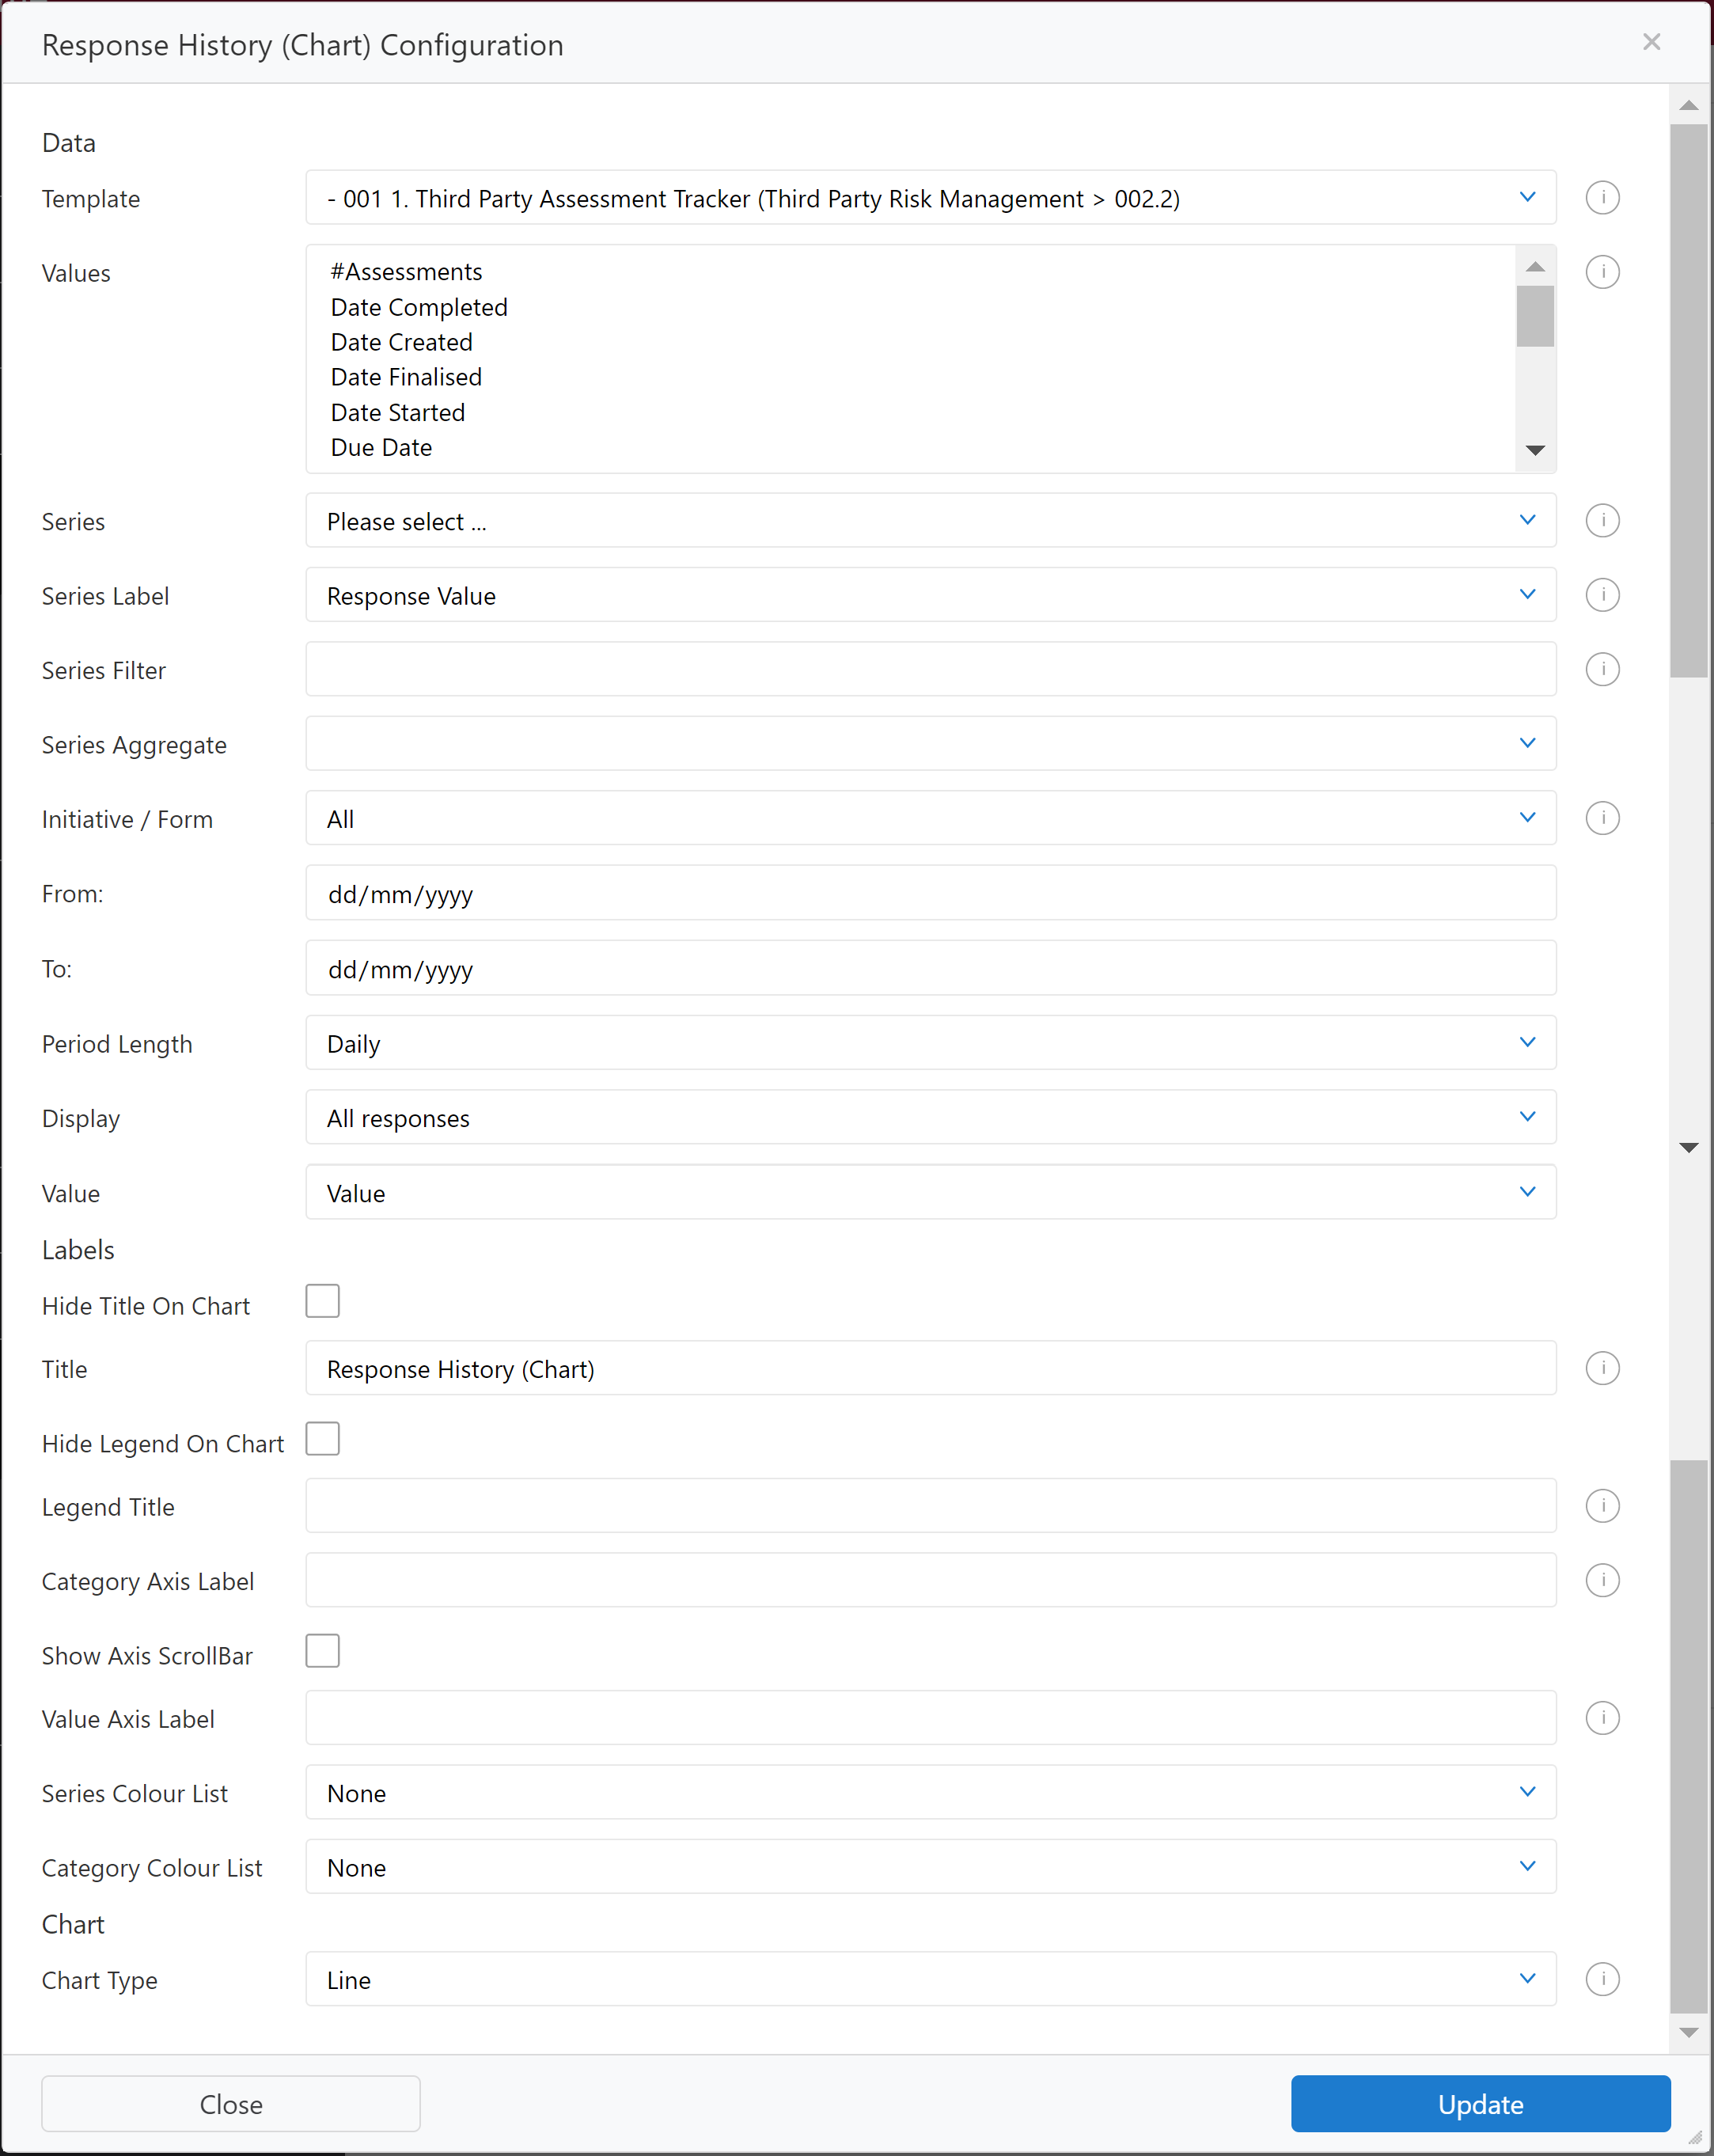
Then select the template you wish to report on (for our example, we will be reporting on the Third Party Assessment Tracker). When this is selected, you will have the following options:
| Option | Guidance |
| Values | Do not select any options in this box. |
| Series | This is where you select what is plotted on the graph, i.e. what response's history you wish to plot. |
| Series Label |
This is where you select how the series are grouped. For example, if you would like to see the Tiers you would select "Response Value". If you would like to see per Third Party, you would select "Section", as each Third Party has it's own section within the Third Party Assessment Tracker Form that is being reported on. |
| Series Filter |
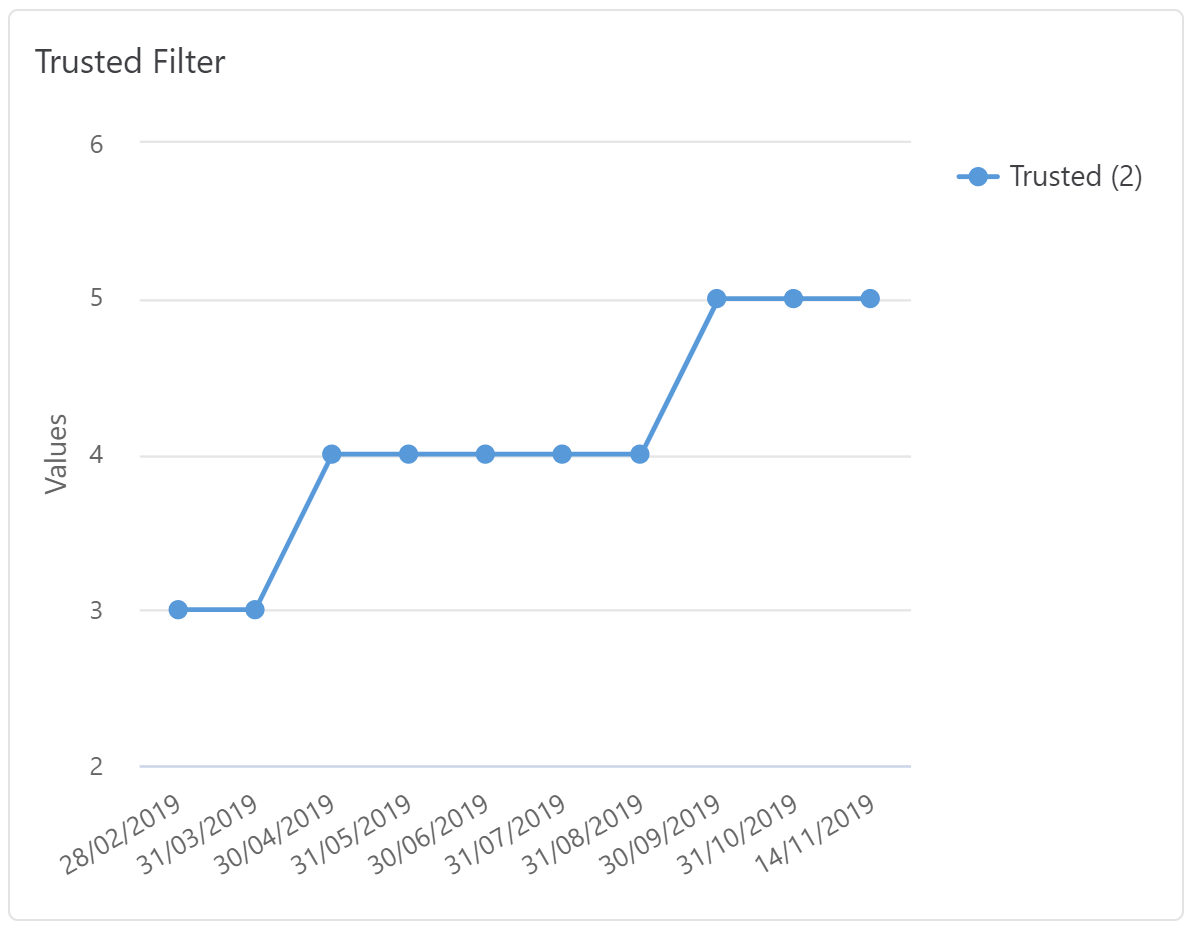
This is where you filter the series selected. This is based on the JavaScript method of RegEx. For example, if I only want to see the Third Parties with Tier "Trusted (2)", I would use the filter "Trusted \(2\)" - for more help with this, please contact support. A helpful website for calculating these is https://regexr.com/. Please see below example. |
| Series Aggregate |
This is a drop-down list where you can choose either "Count", "Max", "Min", "Sum" or "Average". If you are reporting off a non-numerical field, you will need to use "Count. |
| Initiative/Form | This is drop-down list where you can filter the initiative or form you look at the responses from - for example, if you want to look at a specific risks or group of risks history. |
| From/To | This is a date picker where you can choose the date range in which the response history is being reported on. |
| Period Length |
This decides how often the response history is reported on - you can choose "Daily", "Weekly", "2 Week", "4 Week", "Monthly", "Quarterly" or "Yearly". |
| Display | This selects what values you want to display for the response history. If this is a value field, you can report on things such as the maximum and average. If you are not reporting from a value field, use "All responses". |
| Value | This selects the value you want to show for the response history. This needs to be "Value", unless it is a numerical field. |
| Title | This is where you customise the name of the portlet - by default this is "Response History (Chart)". |
| Axis Label | This is where you can add an extra text axis label to the series/category. |
| Series Colour List | This is where you can set what colours you would like your reporting to change to. |
| Chart Type | This denotes the different types of charts you wish to display your data as, which includes (but is not limited to) bar, line and radar. |
Examples
Series Filter
Series Filter for "Trusted" - Trusted \(2\)
Comments